
The wall, running
Seven tags on a process line: chiller, buffer tank, mixer, oven. Values move on a 260 ms sample. Push one out of its band with the fault buttons and watch what the wall does about it — then shelve the alarm and watch the shelve run out.
A reference build, not client work — the feed is simulated so the piece can be published. The renderer, the band logic, the escalation and the acknowledge/shelve behaviour are the same ones we deploy; only the source of the numbers differs.
Why the data is already there
Nearly every manufacturing client we have worked with in Johor already has the sensors. Chillers report their supply temperature. Ovens have zone thermocouples. Tanks have level transmitters. Drives report speed and current whether anyone asks or not.
What is missing is not instrumentation. It is that the readings live in a vendor portal with a separate login, opened by one person, usually after something has already gone wrong. The data is a forensic tool when it could be a preventive one, and the gap between those two is a screen.
So the pitch is unusually cheap: you have already bought the hard part. A wall does not require new hardware, it requires a feed and a decision about what "normal" means.
The failure mode: alarm fatigue
Here is the part that decides whether this is worth building, and it is not technical.
A wall that cries wolf is ignored within a fortnight, and it is then worse than nothing — because everyone believes the plant is being watched. The failure is quiet and total: the screen keeps working, the alarms keep firing, and the room has collectively agreed to stop seeing it.
We have watched this happen on other people's installations three times. The pattern is always the same:
- Thresholds are set from equipment datasheets rather than from what this plant actually does.
- Everything that can be measured gets an alarm, because it was easy to add.
- Nobody can say what to do when a given alarm fires, so nobody does anything.
- An alarm that has fired eleven times this week with no action attached is not information. It is noise with a colour.
The screen is blameless. The design is not.
Four rules that keep a wall trusted
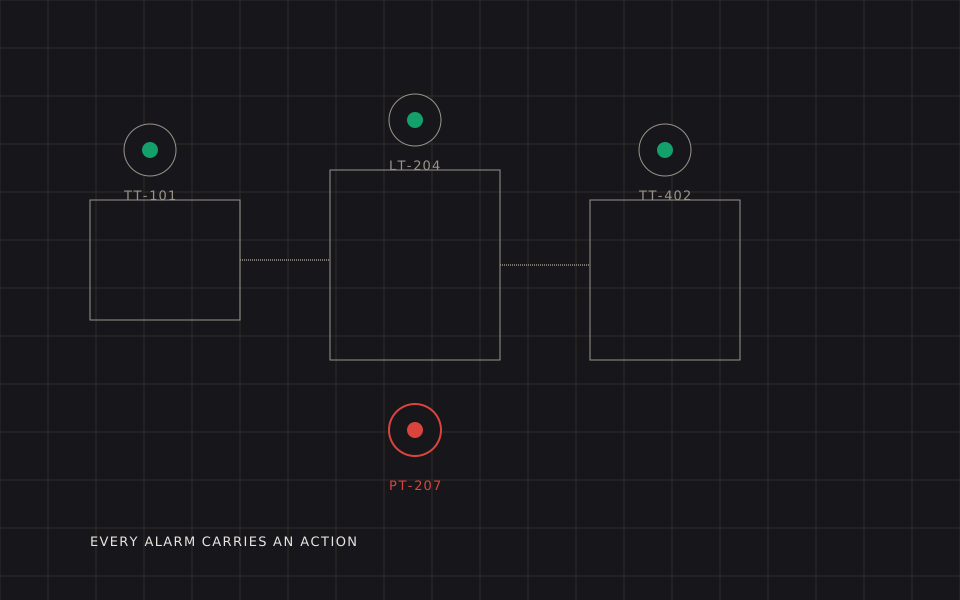
1. Every alarm carries a documented action
This is the one that matters most, and it is enforced in the data model rather than in a policy document. A band and an action are a pair: the wall above refuses to start if a tag carries one without the other, which is the only version of "enforced" that survives a busy week. Here is the rule, and the two tag shapes it allows:
{ id: 'TT-402', name: 'Oven zone 2', unit: '°C',
  lo: 168, hi: 196, warn: 8,
  action: 'Zone 2 over-temperature scraps the batch.
           Stop the belt, then call the shift lead.' }

{ id: 'TT-009', name: 'Ambient, plant floor', unit: '°C' }
// No action anybody could write down, so no band, so no red.

list.forEach(function (t) {
  var banded = t.lo !== undefined && t.hi !== undefined;
  if (banded !== !!t.action) {
    throw new Error(t.id + ': band and action, or neither');
  }
});
If nobody can write that sentence, the tag does not get an alarm band. It still gets displayed — knowing a number is useful — but it cannot go red. If you cannot say what to do about it, it is not allowed to interrupt anyone.
The seventh tag on the wall above is there to make that concrete. TT-009 is the plant floor temperature: worth seeing, and impossible to write an action for, because "it is August" is not a step anybody can take. So it has no band, it carries no colour, and it is marked display only. It cannot interrupt a shift.
Open the fault buttons and read the event log. Every entry tells you the next physical action, not just which tag moved.
2. Two bands, not one line
A single threshold turns every sensor into a light switch, and real signals sit near their limits for perfectly ordinary reasons. Each tag here has an operating band (lo–hi) and a tolerance beyond it (warn). Outside the band is warning — worth a glance. Outside the tolerance is alarm — worth an interruption.
That single distinction removes most of the noise, because the majority of band excursions in a working plant are brief, self-correcting and completely normal.
3. Acknowledge and shelve, both visible
An operator who can see a problem and cannot tell the system that they have seen it will start ignoring the system. Acknowledge says "I have this". Shelve says "I know, it is a known fault, stop shouting for an hour".
Shelving is the controversial one and it is essential. Without it, a sensor with a failed lead makes the entire wall useless for a week. With it, the failed sensor is visibly parked and everything else is still legible. What matters is that shelving is visible and temporary — a shelved tag reads as deliberately silenced, not as healthy, and the silence runs out on its own.
Both halves are in the demo. Shelve an alarm and the tag greys out, drops off the active count, and starts a visible countdown on its own tile. When the countdown reaches zero the alarm comes back by itself, because the problem did. A shelve is an hour on a real wall; here it is 45 seconds, since the whole argument is that it expires and nobody is going to sit on this page for an hour to watch that happen.
4. Thresholds belong to the people who run the process
We set none of them. We run a session with the shift leads, write down the number, the person and the date, and put that record next to the tag. Six months later, when somebody asks why the mixer warns at 46 °C and alarms at 50, there is an answer with a name on it.
How it is built
The renderer is the same technique as our vector state machine: hand-written SVG generated from a table, no charting library, no runtime.
- The schematic is a drawing, not a chart. Operators navigate by physical layout — "the tank after the chiller" — not by a legend. Instrument bubbles sit where the instrument is.
- Colour is the only hue on the plate. Everything is a hairline in ink, so the four status colours are the only chromatic values on screen. On this wall, colour always means state, which is why a single amber dot is visible from across a workshop.
- Value goes with the tag, not into a chart. A tile per tag with the current reading, the band, and a marker showing where in the band it sits. Trends belong on a second screen for the engineer, not on the wall for the floor.
- The loop parks when off screen. An animation frame loop running on a forgotten tab is a battery bug; this one stops when it is not visible and restarts when it is.
Under nine kilobytes minified, no dependencies, and it re-themes with the page because every stroke is a design-system token. That last property matters more on a factory wall than anywhere else: a dark theme at night is not decoration when the screen is the brightest object in the room.
What changes with a real plant behind it
Three things, and none of them touch the renderer.
- The feed. Gateways push MQTT or Modbus into a small collector; the wall subscribes. The demo's random walk is the only piece that gets deleted.
- History. A time-series store behind it, so "when did this start" is answerable. The wall stays live-only on purpose — history is a different screen for a different person.
- Escalation off the wall. An alarm at 2 am with nobody in the room needs to reach a phone. That is a rota, a quiet-hours policy and a delivery path, and it is the part clients consistently underestimate.
Most of the work in a first line is the gateway and the threshold sessions rather than the screen. If your sensors are already reporting somewhere you control, considerably less.
If you have a process where two hours of unnoticed drift is expensive, that is the conversation.
Questions
Usually not, and often you already have one that nobody looks at. SCADA is a control system — it exists to make the plant do things. A telemetry wall is a read-only view whose only job is to be understood from fifteen metres by someone walking past. Those are different products with different failure modes, and building the second on top of whatever you already have is far cheaper than replacing the first.
Then that is the project, and it is worth knowing before you budget the screen. Most industrial gateways will push MQTT or Modbus to something you control; the ones that will not are usually rentals rather than purchases. We assess this first, because a beautiful wall with no feed is a wallpaper.
We do not. The people who run the process do, and we write down who decided each one and when. A threshold chosen by an engineer reading a datasheet is the fastest route to alarm fatigue — the datasheet says what the equipment tolerates, not what this plant considers normal at 3 pm in August.